The DNA in our cells is packaged into forty-six chromosomes in the nucleus. If the DNA in one cell were stretched out, it would be about two meters long. Likewise, to measure the universe, its vastness can only be measured in light-years! Observing God’s creation ignites our curiosity. Collecting data allows us to see patterns and promotes questions and wondering.
Wondering leads to awe, and awe often leads to the worship of God, praising him for his intricate design and care for all that he made. God’s creation is inspiring and amazing. There are many classroom practices and tools that help students question, wonder, and respond in awe to our Creator. The Gather, Reason, Communicate (GRC) framework is one of these practices. This framework is a student-centered instructional approach that can be used within a 5E instructional model lesson to promote awe and wonder. This article breaks down each of three parts of the Gather, Reason, Communicate framework and explains how they are implemented in Beth Boven’s middle school science classroom at Calvin Christian School in South Holland, Illinois.
Gather
Gathering practices, or Gather from the Gather, Reason, Communicate framework, is phenomena-based instruction that involves asking questions, carrying out investigations, collecting qualitative observations, and recording quantitative data. According to this framework, “A phenomenon is an observable occurrence or event that can be investigated to gather evidence to support a scientific explanation.” Student curiosity and their desire to make sense of their observations is a key part of science inquiry. Observation skills such as inferring, measuring, communicating, predicting, and classifying are essential practices of all scientists. Students used these skills to begin to answer their questions about the phenomena they observe.
During a visit to a local pond, Beth’s class learned about the tools scientists use to make accurate measurements of the world by describing the ecosystem using qualitative and quantitative data. In the science classroom, students are taught to make qualitative and quantitative observations. Qualitative analysis involves data collected using our senses, while quantitative data includes numbers, quantities, and numerical analysis.
When describing the water, the student listed qualities such as color and smell. For quantitative observations of the pond, students measured the water’s pH, turbidity, and temperature. While making observations, students noticed algae in the lake and wondered what conditions caused algae to grow? Phenomena are observable facts or events. The Calvin Christian students observed the pond ecosystem, which led to questions and to their interest in the study of algae growth. The Gather stage of this model engages the student in making observations, asking questions, and collecting quantitative and qualitative data that answers questions concerning the observed phenomena.
Reason
The Reason part in the Gather, Reason, Communicate Framework, refers to reasoning practices. These practices include analyzing data and constructing evidence-based explanations, evaluating data collection techniques, using computational thinking, and constructing an explanation based on evidence collected. In Beth’s classroom, students constructed an explanation supported by their investigation evidence for the conditions that cause algae growth.
I spoke with Beth, who was also a lead teacher at CSESA 2019, about the ways she instructs her students to prepare their data collection techniques and tools thoughtfully. She challenges her students to think critically about what they want to know and how to search for explanations. This first step includes thinking about the type of data being collected. Are students comparing two events? Is there a way to find quantitative data—data that can be counted or measured and then used to compare? Or are the students looking at qualities that are not numerical?
For example, Beth’s sixth-grade students recently took part in an investigation to find out what factors affect the growth of algae in a pond. Students made initial qualitative observations of the lake and collected pond water algae. Each group designed their investigation to determine the impact of things like temperature, light, soap, and pH on the growth of algae. The algae were placed in test tubes, and each student group made daily observations. When it came time to compare data, students discovered that each group’s sketches, collection methods, and descriptions of the pond algae were very different. Beth takes these moments to spark critical thinking discussions and debate within her classroom. Are all students using the same units of measurement? What units are most appropriate for the data being collected? How many trials should be done? According to Beth, “The moments when students struggle with data and how to use it is when students begin to think and act like scientists.” Another way to put this would be those moments where our students struggle with their data and how to use it are where our burgeoning scientists find their footing!
Communicate
The last part of the Gather, Reason, Communicate framework, Communication, makes student thinking visible. Students construct an argument that describes how the evidence gathered supports the explanation. Communication includes conveying information, arguing from evidence, using models to describe the investigation findings, visual representation of data (graphs), and student presentation of information.
Beth and I share a passion for student participation in the science fair. This project-based inquiry experience immerses students in a self-directed investigation that culminates in analyzing and representing data, designing project boards, and an oral presentation. In Beth’s classroom, she pairs older students with younger students. The older students answer questions, assist with data analysis, and become an authentic audience for the younger students. Together they practice the 21st-century skills of creativity, collaboration, and communication.
The science fair is an authentic way for students to implement science practices, argue from evidence, use models to communicate, and explain why and how their data supports their science claim. One of the most significant parts of an inquiry experience like the science fair is turning raw data into a chart or graph. Looking at data is a fantastic opportunity to offer student choice, differentiation, and communicating findings. When students make their own decisions about the type of graph to use, they think critically about what will be communicated through their representation. When asked about student data collection, data representation, and graphing, Beth shared “I find in my classroom that I’m frequently surprised by new ways that students display and describe their findings. I smile when I see students take ownership of their work and when they are invested in defending their ideas. We give glory to God when we celebrate all types of learning and when we spark creativity in the scientific process.”
As we prepare our students to be the caretakers of creation and collectors of information in our world, they must leave our classroom knowing how to critically evaluate data that is presented to them. We want students to seek and communicate truth in our world—and we can start doing this in our own science classrooms through effective practices like the Gather, Reason, Communicate framework.
Resources
Going3Dw/GRC. Phenomenal GRC Lessons. https://sites.google.com/3d-grcscience.org/going3d/home?authuser=0
Moulding, B., Bybee, R., and Paulson, N. A Vision and Plan for Science Teaching and Learning: an Educator’s Guide To a Framework For K-12 Science Education, Next Generation Science Standards, and State Science Standards. Essential Teaching and Learning, 2015.
Moulding, B., Bybee, R., and Paulson, N. Teaching Science in Phenomenal: Using Phenomena to Engage Students in 3D Science Performances consistent with NRC Framework and NGSS: organizing student science performances using 5E and Gather, Reason, Communicate Instructional Sequences. Washington, UT: ELM Tree Publishing, 2017.
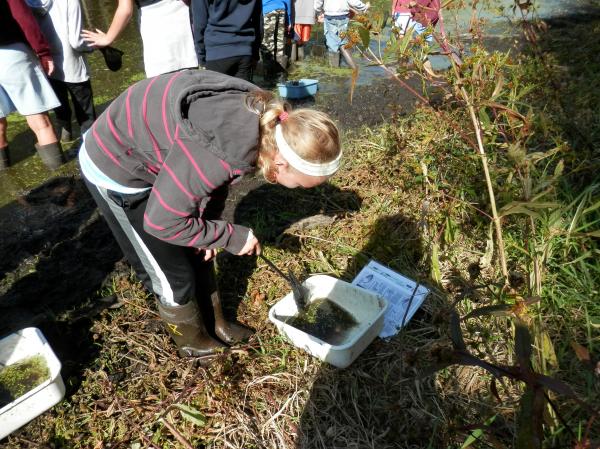
Observing phenomenon, asking questions, inferring, measuring, predicting, and classifying are an important part of the Gather stage and are essential practices shared by all scientists.
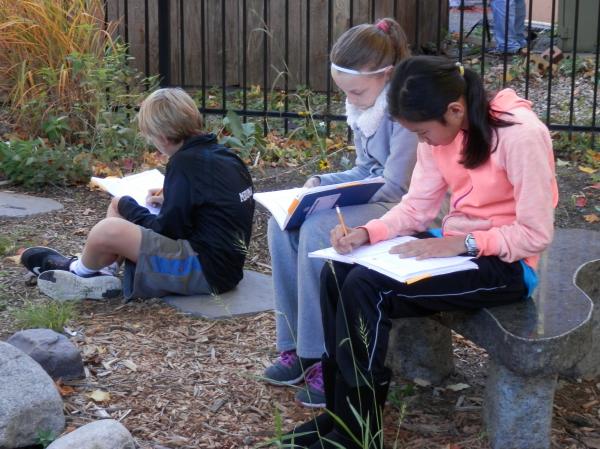
Recording qualitative observations involves data collection using our senses. Written reflection provides opportunities for students to see patterns, ask questions, and wonder.
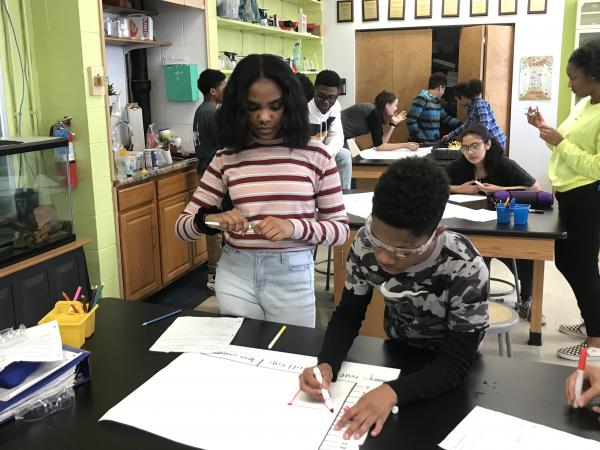
During the Reason stage, students often work together to analyze data, construct evidence-based claims, and think critically about what their graphs communicate.
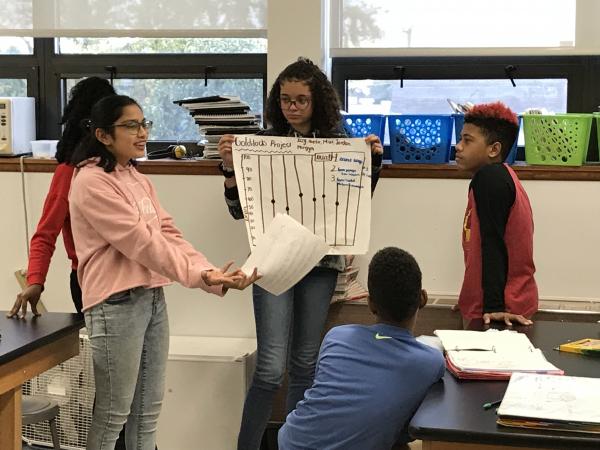
Communication makes students’ thinking visible. Learning to analyze, interpret, and present data provides an opportunity for differentiation and student choice.
Using Phenomena in Science Lessons and Units
How do educators use phenomena to promote student inquiry? Read about the what, why, and how of phenomena in the science classroom.